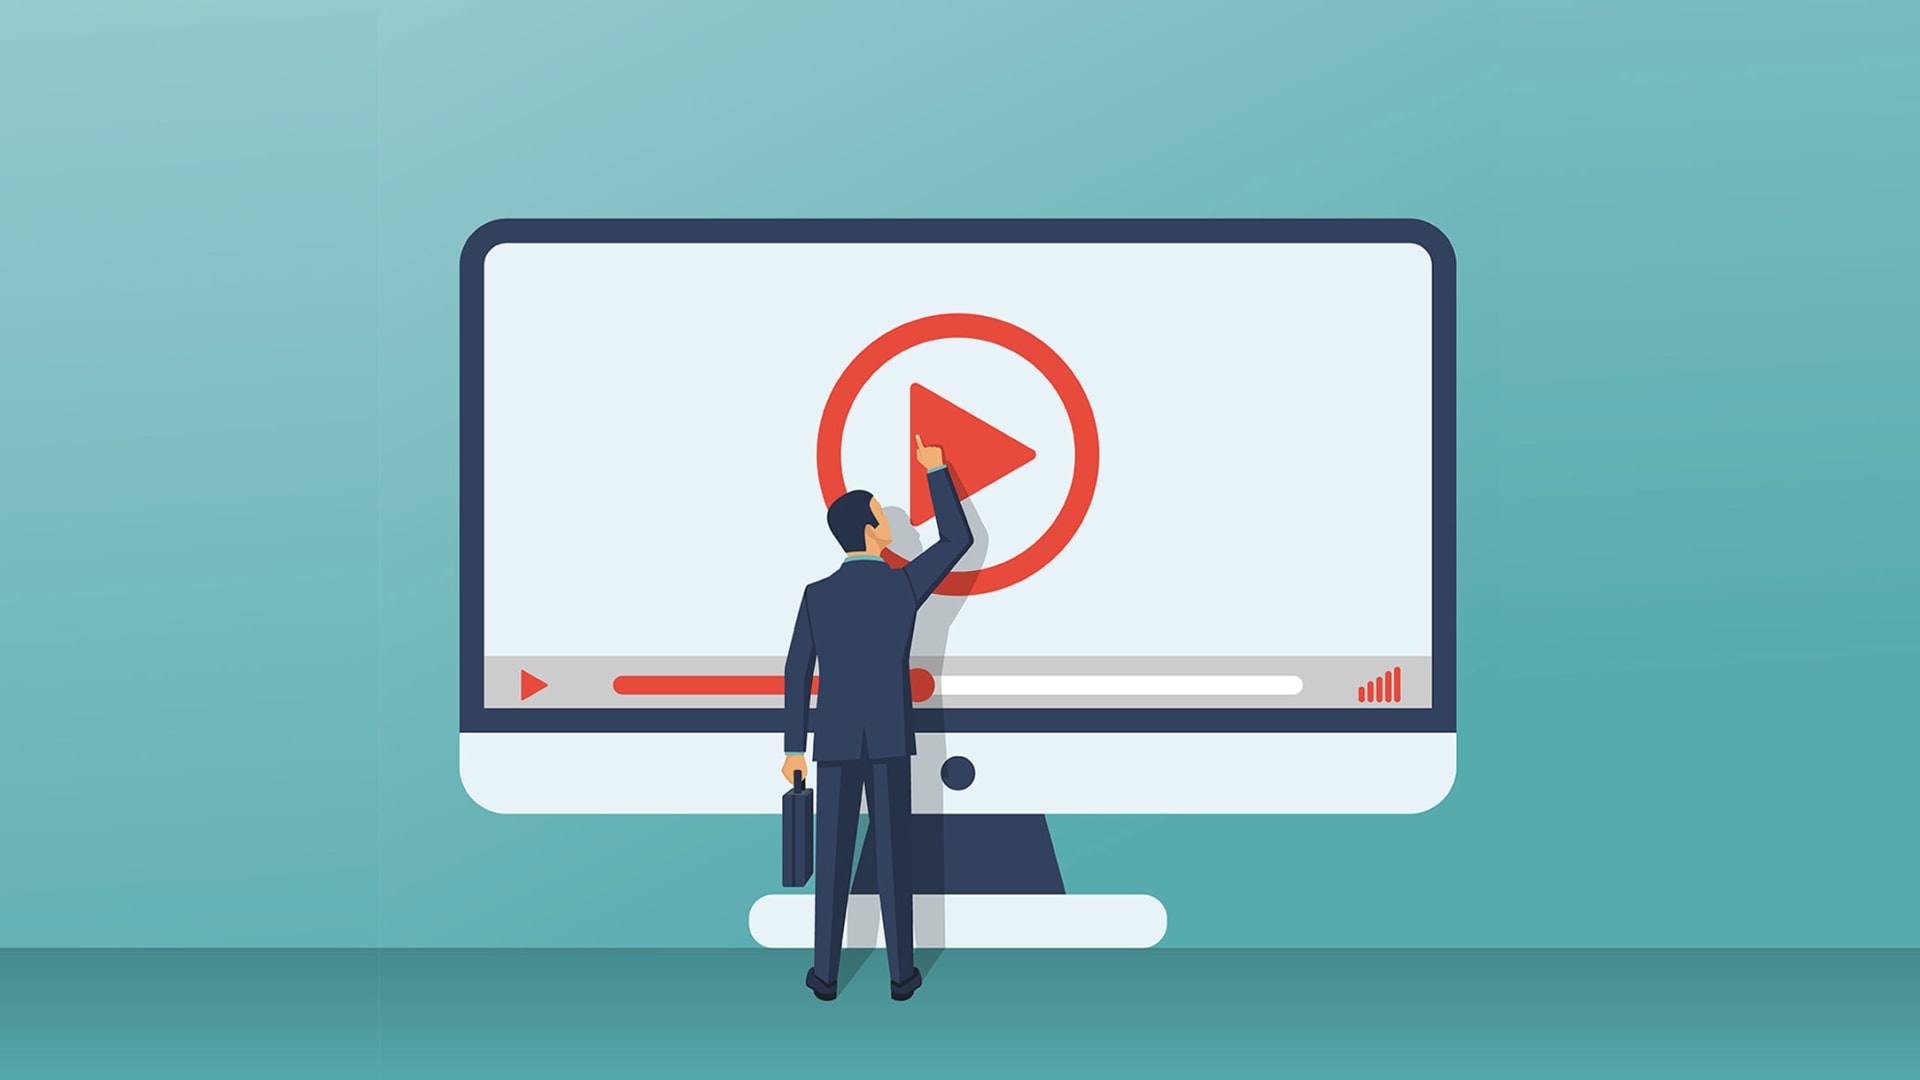
A lot of website owners don’t know what a video SEO strategy entails. A video optimization strategy is a planned approach to increase the ranking and success of our videos on search engines. This can be done by optimizing the title, keywords, descriptions, file names, and thumbnails.
SEO or Search engine optimization is the process of improving our website so that it ranks high on search engines like Google. Creating a video SEO strategy will allow us to rank higher on the search engines and reach more leads. It is really important for online marketing because many people use the internet to look for information on businesses as well as products.

The title is the most sought-after element in video SEO. For example, a title for a video about a hot dog stands out, but if we’re trying to rank an article about how to create a new algorithm for search engine optimization, we can’t expect much from it. The title acts as a summary of our video and should be specific and accurate. If possible, we should write our titles using the keywords that will bring traffic.
A good title is what people search for first. The title of our video is what will draw people to our site. We must try to make sure that we have a catchy title.
We must choose keywords that are relevant and accurate. As of right now, YouTube has over 1 billion unique visitors per month. Of this number, the majority of people are looking for information. We can use those words to find keywords that will bring us traffic. The more specific our video is, the higher it will rank in search results. It is important to include a few of our main keywords in the title, but we should avoid using them too much because it seems to be spammy.
Choosing the right keywords can help our video get noticed. If we want to rank our video, we have to choose the right keywords. These keywords should be relevant to our business and what we are trying to sell. We can choose the most likely one with the highest search volume in our niche market so that there is a better chance of ranking high in the search results. We can also use an online video editor to create high-quality content that will attract many viewers.
The description is a good place to tell our viewers about the information in the video. It’s just like writing a description of the content on our website. The description should include the keywords that we want to rank for, it should relate to our business, and it should be unique. A unique description will help people see that our videos are original with quality content, and this will increase traffic and help them decide whether to watch them or not.

The description of our video is also very important as it acts as a description for the whole video on Google. It should be short and precise with keyword tags so that when a user searches by entering a keyword on Google, it brings up our video rather than another video on another topic altogether.
You must create videos that are captivating and engaging enough to inspire viewers to buy what you’re selling if you want them to become paying customers. At the conclusion of your video, you should also include a call to action to let viewers know what they should do next.
The thumbnail is the first thing people will see when looking for videos to watch. Our thumbnail should be eye-catching and directly related to the video, which will help them decide whether or not it is what they want. It should be different from all the others.
The thumbnail should be about half the recommended thumbnail size. The size of the thumbnail is an important factor in video SEO. People will not click on our videos if they are too small or too big. It has a direct effect on how many people will see our videos and how many people will choose to watch them. A good thumbnail should be about 400px by 300px. We can use YouTube’s recommended formula to make a thumbnail that has a high chance of receiving views. We can use a video editor to create a thumbnail for our videos that looks good and is eye-catching.
The name of our file is important when it comes to video SEO strategy. If we’re going to name our files, we must make sure they are related to the content and not just a random string of characters because this will help people find our file more easily. Also, we must make sure that the file name is short, memorable, and does not have any spaces between them. The file name will appear in search engine results next to our title and description. This is where we can include any keyword that we think will get a lot of traffic to ensure people can easily find us online.
Adding transcripts to the video is a good idea as it helps people who are watching it to learn more about the content of our video. Transcribing our videos can help people learn and understand what we’re selling. Also, this will make them more likely to buy, and in turn, our sales will be higher. We can create a transcript with subtitles on the side of our video so that people who want to watch it can do so by properly understanding the whole content.
Most people access the internet through mobile devices. So, we should optimize our videos for those devices. If a viewer is watching our video on a mobile device, then they should be able to see all of the content of the video as it is presented. This means that the size, length, and quality should be good and easier to understand with less compression. We can also optimize for smaller resolutions and significant compression allowances using an online video editor, so when a customer looks at our site on a mobile device, they can easily judge the quality of our videos before buying from us.
So, as we can see, there is a lot to do with video SEO, and it can be a lot of work. But we must consider all this when we’re creating our videos because there are so many elements that will help us rank higher on the search engines.
A good video SEO strategy will help us find more customers and get them to buy our product or service. The steps mentioned above can help, and we must not forget to put links in the descriptions and tags, as well as optimize for mobile devices so that viewers can easily find and watch our videos.